The Data-Driven Library: Informing Strategic Decisions Through Analytics
In an era defined by “Big Data” and ongoing digital transformation, libraries are evolving into dynamic, user-centric institutions.2 To maintain relevancy and be fiscally responsible, all libraries—whether public or academic— have embraced data-driven decision-making (DDDM) [3]. By leveraging analytics on collection use, user behavior trends, and resource consumption, library leaders gain valuable, actionable insights that directly inform strategic planning, resource allocation, and service development [1, 7].
https://journals.sagepub.com/doi/10.1177/03400352251318753#bibr45-03400352251318753
Stakeholders, from university administrators to local government, expect libraries to generate reports and justify their strategies and budgets using aggregated, evidentiary data [3, 7]. This article explores how collecting, analyzing, and acting upon this data is indispensable to the modern library’s strategic direction.
Understanding the Data Landscape
Libraries produce massive volumes of data daily, often categorized into three key areas for strategic analysis: collection use, user behavior trends, and resource consumption [1, 7].
1. Collection Use: Optimizing the Repository
Collection use data provides the most direct evidence of which materials—print and digital—are meeting patron demand and which are underperforming. Analyzing this data is crucial for effective collection development, minimizing redundancies, and ensuring resources align with community and institutional goals [1, 7].
- Circulation Records and Usage Statistics: Analyzing circulation data for print materials allows libraries to identify popular subjects and preferred formats (e.g., e-books vs. audiobooks) [1].3 For academic libraries, access logs for e-journals and databases are essential for understanding how patrons utilize high-cost subscription content [1, 7]. The Association of College and Research Libraries (ACRL) Benchmark tool, updated with 2023 survey data, provides peer comparisons across these metrics to aid in strategic assessment [7].
- Predictive Analytics for Acquisition: Moving beyond reactive purchasing, libraries are increasingly using predictive analytics to forecast future demand, often involving machine learning and AI [2, 6]. By analyzing historical usage, acquisition patterns, and search trends, librarians can anticipate desired new materials, enabling them to prioritize high-demand acquisitions and allocate budgets more effectively [2]. For instance, by correlating research trends and historical circulation, libraries can proactively stock resources before demand peaks, a strategy proven to streamline operations and enhance client contentment [2, 6].

- Weeding and Retention: Data-driven decisions also apply to de-selection (weeding).4 By examining the low-use and non-circulating materials, libraries make informed choices about retention or disposal, freeing up valuable shelf space and ensuring the remaining collection is active and relevant [7].
2. User Behavior Trends: Tailoring Services and Spaces
Beyond collection turnover, libraries gather vast data on how patrons interact with the library, both physically and virtually.5 This data provides the intelligence needed to customize services, optimize operational efficiency, and enhance user engagement [1].
- Physical Space Utilization: Gate count and reading room usage statistics, along with Wi-Fi session and public computer use data, provide insights into peak utilization times and how physical space is used [1]. One study demonstrated that simple space-planning changes, based on frontline staff observations and analysis, could double circulation for a browsing collection by increasing visibility and optimizing traffic flow [5]. Data is vital for ensuring physical layouts align with current service needs, such as balancing collaborative learning spaces with areas for intensive academic work [7].
- Digital Engagement and Search Queries: Analyzing website analytics and search queries provides deeper insight into information-seeking intent [1]. A surge in
https://clarivate.com/pulse-of-the-library/
searches for a new academic program or a local industry trend, for example, can quickly guide the acquisition of relevant digital resources [2].
- Technology Adoption: Data from the 2023 Public Library Technology Survey highlighted trends in technology lending, noting that almost 47% of public libraries offered hotspots for checkout [9]. This data not only justifies continued investment in technology lending programs but also informs decisions on which specific technologies (e.g., e-readers, media production equipment) to prioritize based on local demand and demographic usage [9].
3. Resource Consumption: Budget and Staffing Optimization
Resource consumption data focuses on internal operational efficiency, allowing libraries to align strategic direction and budget planning [3].
- Budget Allocation for Subscriptions: Subscription costs are a top factor influencing the ability to offer digital content, cited by 86% of libraries in a 2023 survey [9]. Analyzing database usage metrics (e.g., cost-per-use, number of downloads) allows libraries to compare vendor value and make data-driven decisions on which high-cost, low-use subscriptions to discontinue and which essential resources require a larger budget [1].
- Staffing and Training: Analyzing reference and inquiry logs, along with data on the type and volume of specialized data service requests, informs staffing needs and professional development [4]. As faculty data needs shift from simple management to complex services (e.g., consultations on Python or R), data indicate the need to hire or train “data-savvy” librarians to meet these new demands, which are often integrated into the library’s strategic plan [4].
- Operational Hour Adjustments: By correlating gate-count data with service point usage, administrators can adjust operational hours or service desk staffing to maximize efficiency, minimize waste during low-use periods, and maximize support during peak times [1].
The Strategic Value of Visualization and Advanced Modeling
The true power of library data is realized when it is transformed from raw numbers into actionable intelligence through visualization and advanced modeling [1, 2].
- Interactive Dashboards: Creating interactive dashboards that display key usage metrics (e.g., peak utilization times, most accessed databases) shifts the narrative from raw analytics to insightful, understandable representations of user behaviors [1, 7]. This makes it easier for library administrators to proactively design impactful acquisition and service strategies [1, 7].
- Forecasting and Proactive Planning: The integration of AI and machine learning into predictive analytics enables the library to shift from a reactive to a proactive stance [2, 6, 8]. For example, the University of Toronto Libraries (UTL) has explored using AI/ChatGPT to streamline data analysis, rapidly identify patterns, and enable more robust, informed strategic decisions in areas such as collection analysis and forecasting user behavior [6, 8].6 This technological leap forward enables libraries to
 respond more dynamically to user needs [6].
Best Practices and Challenges
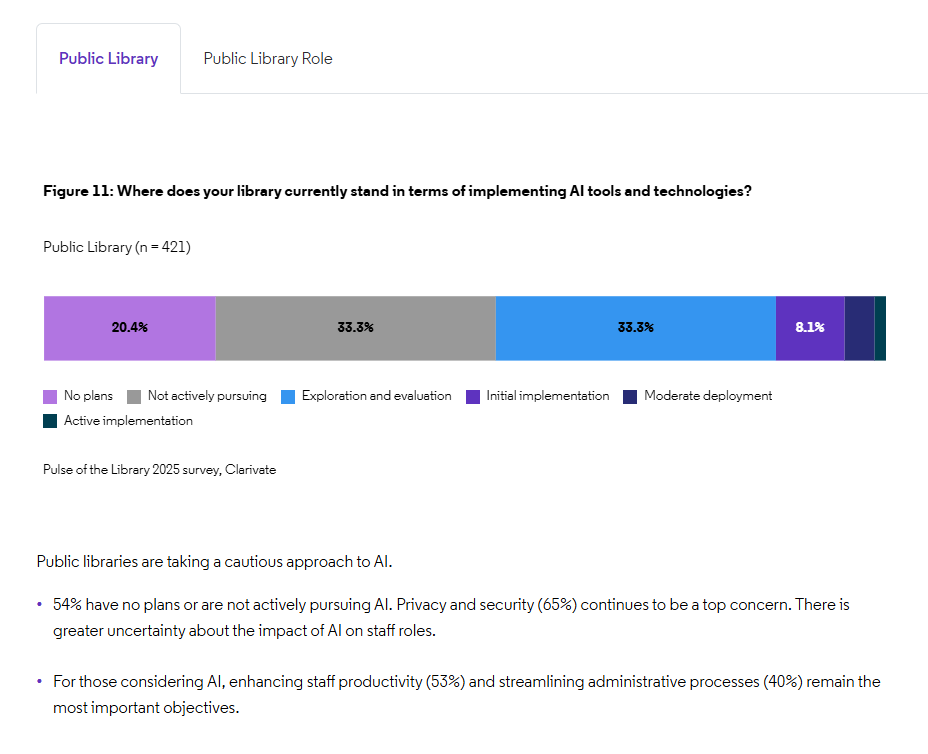
While the benefits are clear, implementing a robust DDDM framework presents challenges, including technological hurdles, integration of disparate data sources, and data privacy [1, 7].
| Challenge Area | Description | Strategic Solution |
| Budget Constraints | Identified by 62% of respondents in a recent survey as the top concern, often constraining investments in necessary tools and training [5]. | Use analytics to demonstrate concrete ROI and value (e.g., cost-per-use of databases) to justify budget requests [7]. |
| Privacy and Ethics | Concerns about security, privacy, and the ethical use of AI (cited by 57% of respondents) remain significant barriers [5, 6]. | Anonymize data and establish transparent data governance policies; focus analysis on aggregated trends rather than individual tracking [6, 8]. |
| Data Literacy & Skills Gap | Equipping staff with the skills to analyze data (e.g., using Tableau, R, or Python) and apply it strategically [4, 5]. | Prioritize staff training in data analysis and assessment methodologies; collaborate with data scientists to develop sophisticated models [4, 8]. |

Conclusion
The use of data analytics on collection use, user behavior trends, and resource consumption is no longer optional; it is fundamental to the sustainable future of libraries [3]. By embracing sophisticated data visualization and predictive modeling, libraries can confidently justify their value, optimize fiscal resources, and provide user-centric services that genuinely meet the evolving needs of their communities. The transition from intuition to evidence establishes a common foundation for strategic planning, ensuring that every decision is an informed, confident step toward maximizing the library’s impact [3].
Sources
[1] Roy, P. (2025). Big data analytics in university libraries on today’s librarianship decision-making: A disruptive innovation perspective. IFLA Journal, 51(4), 1013–1033. https://doi.org/10.1177/03400352251318753
[2] Predictive Analytics and Artificial Intelligence Are Revolutionizing the User Experience in Public Libraries. (2024, October). International Journal of Scientific Development and Research, 9(10). https://www.ijsdr.org/papers/IJSDR2410017.pdf
[3] Massis B (2016), “Data-driven decision-making in the library”. New Library World, Vol. 117 No. 1-2 pp. 131–134, doi: https://doi.org/10.1108/NLW-10-2015-0081
[4] Data services at the academic library: a natural history of horses and unicorns. (2024, April 23). Journal of eScience Librarianship, 13(2). https://publishing.escholarship.umassmed.edu/jeslib/article/id/780/
[5] Pulse of the Library Report (2025). Clarivate. https://clarivate.com/pulse-of-the-library/
[6] Transforming Library Data Analytics into Strategic Insights with ChatGPT. (2024, May 22). University of Toronto Libraries, NASIG 2024. https://journals.publishing.umich.edu/nasig/article/id/7753/
[7] Benchmark: Library Metrics and Trends. Association of College and Research Libraries (ACRL). (Updated 2023 survey data). https://www.ala.org/acrl/benchmark-library-metrics-and-trends
[8] Morgan P. S. (2024). Data-driven decisions: a practical toolkit for librarians and information professionals. The Journal of the Canadian Health Libraries Association, 45(1), 57–58. https://doi.org/10.29173/jchla29751
[9] American Library Association (ALA). (2024). 2023 Public Library Technology Survey: Summary Report. https://www.ala.org/sites/default/files/2024-07/PLA_Tech_Survey_Report_2024.pdf